microbench
Experiment Environment
| CPU | 13th Gen Intel(R) Core(TM) i9-13900K |
| Architecture | x86_64 |
| No. of Cores | 24 (8 P-Cores + 16 E-Cores) |
| No. of Thread | 32 (8x2 P-Cores + 16 E-Cores) |
| Base Frequency (P-Core) | 3.00 GHz |
| Base Frequency (E-Core) | 2.20 GHz |
| Maximum Turbo Frequency (P-Core) | 5.80 GHz (5.50 GHz) |
| Maximum Turbo Frequency (E-Core) | 4.30 GHz |
Isolation
The exactitude of a benchmark depends of its environment. In case of a performance benchmark it is paramount that there are no confounding factors. While larger scale benchmarks such as for a complete application can get away with a noisy environment, care must be taken to establish a clean environment when running micro benchmarks. Some of the confounding factors include
- Scheduling
- Other processes
- Kernel noise
- Interrupts
- Hyper-Threading
- Turboboost
Scheduling
To prevent the kernel from moving the process away from the targeted core, CPU pinning was
used. taskset is a popular way to pin a certain process to a CPU core. sched_setaffinity() can
be used to set the affinity inside the program. The following snippet can be used to pin to a CPU
core.
#define _GNU_SOURCE
#include <sched.h>
#define TARGET_CPU 4
void cpu_pin()
{
cpu_set_t mask;
CPU_ZERO(&mask);
CPU_SET(TARGET_CPU, &mask);
if(sched_setaffinity(0, sizeof(mask), &mask) < 0){
	return -1;
}
return 0;
}
Other Processes
Just as the last section there are numerous ways to prevent other processes being scheduled on
a core. Setting the boot parameter isolcpus, using cpuset etc … Following the official ubuntu
documentation systemd slices were created to isolate the CPU core.
systemctl set-property --runtime custom-workload.slice AllowedCPUs=4
systemctl set-property --runtime init.scope AllowedCPUs=0-3,5-31
systemctl set-property --runtime system.slice AllowedCPUs=0-3,5-31
systemctl set-property --runtime user.slice AllowedCPUs=0-3,5-31
The testbench was run using the following
systemd-run --scope -p Slice=custom-workload.slice build/harness
Kernel Noise
Using the boot parameter nohz_full=4 the kernel will avoid doing its routine tasks on cpu04.
Interrupts
Interrupts we set to use cores other than 4 using procfs. /proc/irq/<IRQ NUM>/smp_affinity_list
we written with 0-3,5-31
Hyperthreading
Hyperthreading was turned off using
echo off | sudo tee /sys/devices/system/cpu/smt/control
Turbo Boost
To get the most accurate measurements, Intel’s Turbo boosting was turned off using
echo "1" | sudo tee /sys/devices/system/cpu/intel_pstate/no_turbo/
Measuring harness
asm volatile("CPUID\n\t"
             "RDTSC\n\t"
             "mov %0, %%edx\n\t"
             "mov %1, %%eax\n\t"
             : "=r"(cycles_high), "=r"(cycles_low)::"%rax", "%rbx", "%rcx",
               "%rdx");
asm volatile("CPUID\n\t"
             "RDTSC\n\t"
             "CPUID\n\t"
             "RDTSC\n\t"
             "mov %0, %%edx\n\t"
             "mov %1, %%eax\n\t"
             : "=r"(cycles_high), "=r"(cycles_low)::"%rax", "%rbx", "%rcx",
               "%rdx");
asm volatile("CPUID\n\t"
             "RDTSC\n\t" ::
                 : "%rax", "%rbx", "%rcx", "%rdx");
double count_avg = 0;
for (int i = 0; i < NUM_ITERS; i++) {
  asm volatile("CPUID\n\t"
               "RDTSC\n\t"
               "mov %0, %%edx\n\t"
               "mov %1, %%eax\n\t"
               : "=r"(cycles_high), "=r"(cycles_low)::"%rax", "%rbx", "%rcx",
                 "%rdx");
  // Function to be measured
  asm volatile("RDTSCP\n\t"
               "mov %0, %%edx\n\t"
               "mov %1, %%eax\n\t"
               "CPUID\n\t"
               : "=r"(cycles_high1), "=r"(cycles_low1)::"%rax", "%rbx", "%rcx",
                 "%rdx");
  start = (((uint64_t)cycles_high << 32) | cycles_low);
  end = (((uint64_t)cycles_high1 << 32) | cycles_low1);
  avg += / (end - start);
For few of the measurements we used perf_event_open() API provided by the Linux kernel.
int fd;
long long count;
struct perf_event_attr pe;
memset(&pe, 0, sizeof(pe));
pe.type = PERF_TYPE_HARDWARE;
pe.size = sizeof(pe);
pe.config = PERF_COUNT_HW_INSTRUCTIONS;
pe.disabled = 1;
pe.exclude_kernel = 1;
pe.exclude_hv = 1;
fd = perf_event_open(&pe, 0, 4, -1, 0);
if (fd == -1)
  err(EXIT_FAILURE, "Error opening leader %llx\n", pe.config);
if (ioctl(fd, PERF_EVENT_IOC_RESET, 0) == -1)
  err(EXIT_FAILURE, "PERF_EVENT_IOC_RESET");
if (ioctl(fd, PERF_EVENT_IOC_ENABLE, 0) == -1)
  err(EXIT_FAILURE, "PERF_EVENT_IOC_ENABLE");
/*MEASURE HERE*/
if (ioctl(fd, PERF_EVENT_IOC_DISABLE, 0) == -1)
  err(EXIT_FAILURE, "PERF_EVENT_IOC_DISABLE");
if (read(fd, &count, sizeof(count)) != sizeof(count))
  err(EXIT_FAILURE, "read");
if (close(fd) == -1)
  err(EXIT_FAILURE, "close");
Benchmarks
Function Call Overhead
The target functions had the following structure
void target_func_0(void)
{
	asm volatile ("" : : : "memory");
	return;
}
Below is the compiled assembly code:
00000000000011a9 <target_func_0>:
11a9: f3 0f 1e fa endbr64
11ad: 55 push rbp
11ae: 48 89 e5 mov rbp,rsp
11b1: 90 nop
11b2: 5d pop rbp
11b3: c3 ret
Verifying that the function is actually called
2e44: /--|-> 0f a2 cpuid
2e46: | | 0f 31 rdtsc
2e48: | | 89 fa mov edx,edi
2e4a: | | 89 f0 mov eax,esi
2e4c: | | 89 bd c0 ca f3 ff mov DWORD PTR [rbp-0xc3540],edi
2e52: | | 89 b5 c4 ca f3 ff mov DWORD PTR [rbp-0xc353c],esi
2e58: | | e8 4c e3 ff ff call 11a9 <target_func_0>
2e5d: | | 0f 01 f9 rdtscp
2e60: | | 89 fa mov edx,edi
2e62: | | 89 f0 mov eax,esi
2e64: | | 0f a2 cpuid
Number of arguments
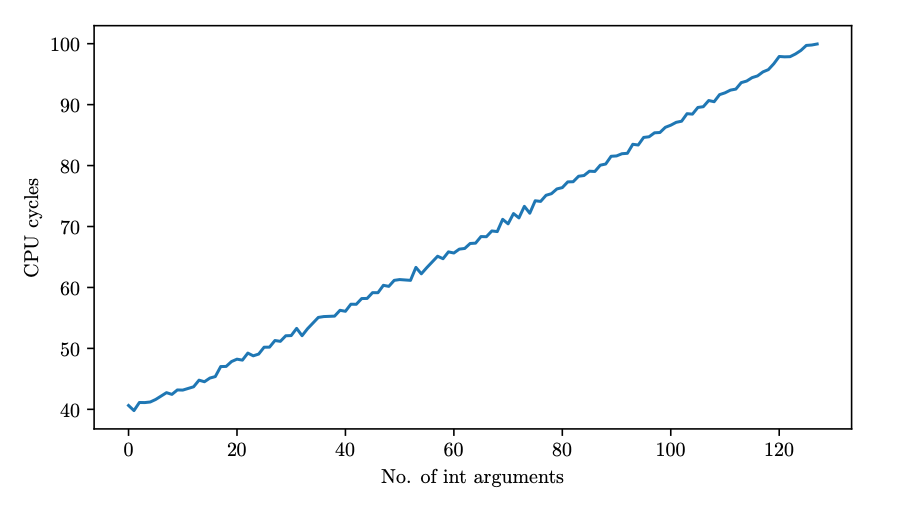 It is clear from the above figure that there is a liner correlation between the number of arguements and
CPU cycles. This is mainly caused by the
It is clear from the above figure that there is a liner correlation between the number of arguements and
CPU cycles. This is mainly caused by the MOV operations required to put the arguments in the
appropriate registers.
420a:       /--|-> 0f a2                    cpuid
420c:       |  |   0f 31                    rdtsc
420e:       |  |   89 d7                    mov    edi,edx
4210:       |  |   89 c6                    mov    esi,eax
4212:       |  |   89 bd 90 ca f3 ff        mov    DWORD PTR [rbp-0xc3570],edi
4218:       |  |   89 b5 94 ca f3 ff        mov    DWORD PTR [rbp-0xc356c],esi
421e:       |  |   44 8b 8d ac ca f3 ff     mov    r9d,DWORD PTR [rbp-0xc3554]
4225:       |  |   44 8b 85 a8 ca f3 ff     mov    r8d,DWORD PTR [rbp-0xc3558]
422c:       |  |   8b 8d a4 ca f3 ff        mov    ecx,DWORD PTR [rbp-0xc355c]
4232:       |  |   8b 95 a0 ca f3 ff        mov    edx,DWORD PTR [rbp-0xc3560]
4238:       |  |   8b b5 9c ca f3 ff        mov    esi,DWORD PTR [rbp-0xc3564]
423e:       |  |   8b 85 98 ca f3 ff        mov    eax,DWORD PTR [rbp-0xc3568]
4244:       |  |   8b bd c4 ca f3 ff        mov    edi,DWORD PTR [rbp-0xc353c]
424a:       |  |   57                       push   rdi
424b:       |  |   8b bd c0 ca f3 ff        mov    edi,DWORD PTR [rbp-0xc3540]
4251:       |  |   57                       push   rdi
4252:       |  |   8b bd bc ca f3 ff        mov    edi,DWORD PTR [rbp-0xc3544]
4258:       |  |   57                       push   rdi
4259:       |  |   8b bd b8 ca f3 ff        mov    edi,DWORD PTR [rbp-0xc3548]
425f:       |  |   57                       push   rdi
4260:       |  |   8b bd b4 ca f3 ff        mov    edi,DWORD PTR [rbp-0xc354c]
4266:       |  |   57                       push   rdi
4267:       |  |   8b bd b0 ca f3 ff        mov    edi,DWORD PTR [rbp-0xc3550]
426d:       |  |   57                       push   rdi
426e:       |  |   89 c7                    mov    edi,eax
4270:       |  |   e8 5e d0 ff ff           call   12d3 <target_func_12>
As we can see from the disassembly, the first six argument are loaded on to registers. The remaining six are pushed onto the stack. The preparation of these arguments is what incurs the latency of a function call.
Data type
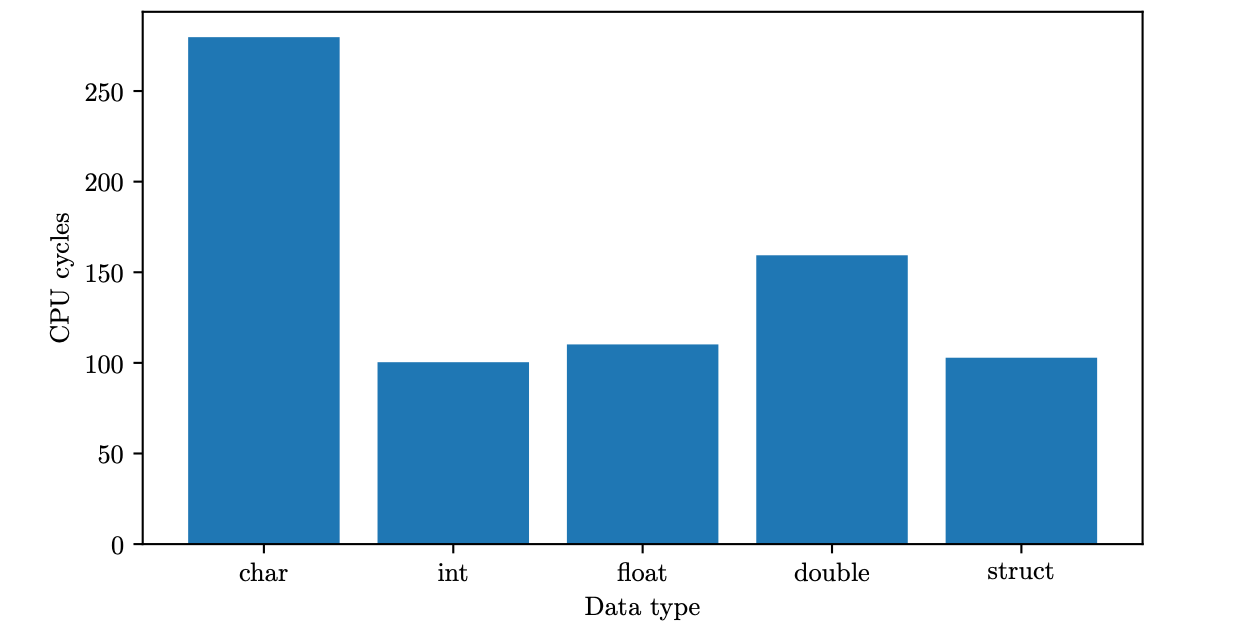
To compare the effects of what data type is used, we compared the basic data types of C, along with
a struct. All of these functions had 127 arguments. Surprisingly char incurs the highest penalty.
1d480:       |  |   0f b6 b5 96 ca f3 ff     movzx  esi,BYTE PTR [rbp-0xc356a]
1d487:       |  |   89 b5 50 c8 f3 ff        mov    DWORD PTR [rbp-0xc37b0],esi
1d48d:       |  |   0f b6 85 97 ca f3 ff     movzx  eax,BYTE PTR [rbp-0xc3569]
1d494:       |  |   89 85 4c c8 f3 ff        mov    DWORD PTR [rbp-0xc37b4],eax
1d49a:       |  |   0f b6 8d 98 ca f3 ff     movzx  ecx,BYTE PTR [rbp-0xc3568]
1d4a1:       |  |   0f b6 95 99 ca f3 ff     movzx  edx,BYTE PTR [rbp-0xc3567]
1d4a8:       |  |   0f b6 b5 9a ca f3 ff     movzx  esi,BYTE PTR [rbp-0xc3566]
1d4af:       |  |   0f b6 85 9b ca f3 ff     movzx  eax,BYTE PTR [rbp-0xc3565]
1d4b6:       |  |   48 83 ec 08              sub    rsp,0x8
1d4ba:       |  |   57                       push   rdi
1d4bb:       |  |   41 50                    push   r8
1d4bd:       |  |   41 51                    push   r9
1d4bf:       |  |   41 52                    push   r10
1d4c1:       |  |   41 53                    push   r11
1d4c3:       |  |   53                       push   rbx
1d4c4:       |  |   41 55                    push   r13
1d4c6:       |  |   41 57                    push   r15
1d4c8:       |  |   8b 9d 0c ca f3 ff        mov    ebx,DWORD PTR [rbp-0xc35f4]
1d4ce:       |  |   53                       push   rbx
1d4cf:       |  |   8b 9d 08 ca f3 ff        mov    ebx,DWORD PTR [rbp-0xc35f8]
1d4d5:       |  |   53                       push   rbx
We hypothesize that this is probably due to the movzx instructions that were carried out. The
push operation for all the functions are the same (they all have the same number of arguments).
The 1024 bytes of struct are moved using rep movs QWORD PTR es:[rdi],QWORD PTR ds:[rsi],
which hides the latency despite the bigger data load.
Context Switch Overhead
To measure context switch overhead, we time 10,000,000 getppid calls. The timings are preceded by
a serializing lfence to prevent rdtsc being called out of order. We find the overhead of calling getppid
is 317 cycles.
Instruction Fetch Throughput
Fetch throughput is calculated by executing instructions that cause contention only
on the Instruction Cache to Decoder portion. Multi-Byte nop instruction was used such that the
decoder is not overwhelmed while saturating the bandwidth of the L1I Cache. nop is the obvious
candidate here as it causes virtually no contention in the backend. The throughput of this micro
benchmark will largely depend on the fetch throughput. It was found that it is able to fetch 2 NOP16
instructions per cycle. Experimenting with regular 1-byte NOP, shows that the processor is able to
fetch up to 3 NOP instructions per cycle. This is true of NOP2, NOP3, NOP4. From NOP5 to NOP16,
the processor only fetches 2 instructions per cycle.
Effective Instruction Throughput
We measure effective instruction throughput by looking at the number of retired instructions according to perf. We use three different workloads: one memory intensive, one compute intensive, and one
that is a hybrid of the two. The compute workload has high ILP, while the other two have lower ILP.
The tests can be run by executing the 03_test.sh script. We find that the max instruction retirement
is 4.55 instructions per cycle, the min is .61, and the median is 1.62
Load/Store Service Rate
To measure the maximum load store throughput we constructed the following benchmark: An
64B-aligned array of size 48K with 6144 uint64_t was created. A fully unrolled sequence of MOV
instruction were constructed. The following registers
[ RAX, RBX, RCX, RDX, R8, R9, R10, R11, R12, R13, R14, R15]
were used. An example of this would be
asm volatile("mov %0, %%rax" : "=m"(src[0])::);
asm volatile("mov %0, %%rbx" : "=m"(src[1])::);
asm volatile("mov %0, %%rcx" : "=m"(src[2])::);
asm volatile("mov %0, %%rdx" : "=m"(src[3])::);
asm volatile("mov %0, %%r8" : "=m"(src[4])::);
asm volatile("mov %0, %%r9" : "=m"(src[5])::);
asm volatile("mov %0, %%r10" : "=m"(src[6])::);
asm volatile("mov %0, %%r11" : "=m"(src[7])::);
asm volatile("mov %0, %%r12" : "=m"(src[8])::);
asm volatile("mov %0, %%r13" : "=m"(src[9])::);
asm volatile("mov %0, %%r14" : "=m"(src[10])::);
asm volatile("mov %0, %%r15" : "=m"(src[11])::);
All 6144 elements of the array were loaded. This would have allowed sufficient Out-of-order execution.
This process was repeated for a parameterized NUM_ITERS time. It was found that the maximum service
rate is 2.27 loads/cycle and 0.97 stores/cycle.
Branch Misprediction Penalty
In order to measure misprediction penalty, we use two loops, one that is easily predicted, and one that has a $\sim50%$ hit rate. The loops are identical except for the arrays that they access, which are of the same size and type. A warmup run is performed for each of the arrays, such that they reside in the L1 cache when they are accessed as part of the branching condition. We ensure that the arrays are small enough to fit inside the L1 cache. The values of the easy to predict array are set in an incrementing pattern, creating an easy taken, not-taken history. The hard to predict array is filled with random values. The branching condition performs an AND operation as follows: (arr[i] & 1ULL). Theoretically, this will result in a roughly 50 percent hit rate for the hard to predict loop. Each loop is in a distinct function, predicatble() and unpredicatble(), which are called NUM_SIMULATIONS times. Within each function, the loop body iterates CACHE_SIZE times – 2000 and 8196 in our case, respectively. Both functions return the sum of the TSC values they gathered. The return value is then added to a counter in the main function, which is divided by the number of simulations. After obtaining these values, the average of the unpredictable function is subtracted from the average of the predictable function. To account for the fact that the unpredictable function has a theoretical 50 percent miss rate, we multiply the difference of the averages by two to account for a lucky correct prediction. We use rdtscp for timing, TurboBoost is disabled, and the binary is pinned to a specific core. After running the benchmark, we achieve a misprediction penalty estimate of 22 cycles.
Integer Execution Unit Bandwidth
A similar pattern to L/S was followed
ADD/SUB
asm volatile(".rept 4096;"
"add %%rax,  %%rax;\n\t"
"add %%rbx,  %%rbx;\n\t"
"add %%rcx,  %%rcx;\n\t"
"add %%rdx,  %%rdx;\n\t"
"add %%r8,   %%r8 ;\n\t"
"add %%r9,   %%r9 ;\n\t"
"add %%r10,  %%r10;\n\t"
"add %%r11,  %%r11;\n\t"
"add %%r12,  %%r12;\n\t"
"add %%r13,  %%r13;\n\t"
"add %%r14,  %%r14;\n\t"
"add %%r15,  %%r15;\n\t"
".endr;" ::
:);
This unrolled independent instructions would allow us to measure the maximum possible throughput.
MUL/IMUL
For 64-bit operands MUL/IMUL uses RAX and takes in r/m64 multiplies them together, stores the upper order bits in RDX and the lower order bits in RAX. This makes it so that we cannot use the pattern we had used till this point. The successor instruction’s source register RAX is also the destination of a predecessor. Hence we simply used
asm volatile(".rept 4096;"
"mul %%r8;\n\t"
".endr;" ::
:);
DIV/IDIV
The DIV operation is peculiar in the sense, it requires a setup before each operation. DIV can cause exception which will cause the program to terminate. Aside from the obvious divide by zero exception, it also terminates if the Quotient overflows. Hence it requires that the input operands be overflow-free every time. And this can’t be a one-and-done thing. DIV stores its results in RAX and RDX, which are then used in the subsequent operation. This may cause an overflow. Hence before each DIV, RAX, RDX must be set to an appropriate value.
This made it so that we were not able to measure cleanly using the traditional timing harness. To overcome this we used ARITH.IDIV(0x15308b0) hardware event. ARITH.IDIV measures the exact number of cycles the Integer Division unit is active.
Though it is possible to interface with the PMUs by writing to IA32_PERFEVTSELx directly, we used the much simpler perf_event_open() interface given by the Linux kernel.
Initialization
/*************
Initialization
**************/
asm volatile("mov %%rax, 0;\n\t" :);
asm volatile("mov %%rdx, 0;\n\t" :);
asm volatile("mov %%rbx, 1;\n\t" :);
/***************************
Unrolled code to be measured
***************************/
asm volatile(".rept 500;"
"mov %%rdx, 0\n\t"
"mov %%rax, 0\n\t"
"div %%rbx;\n\t"
".endr;" ::
:);
| Operation | Bandwidth(Instruction/cycle) |
|---|---|
ADD/SUB |
4.87 |
MUL/IMUL |
0.33 |
DIV/IDIV |
0.1 |
Cache Latencies
Setup
In the L1 and L2, we access an array that is appropriately sized to fit within the targeted level of the cache hierarchy. This will be expanded on in section 4.8.2. For the L3 cache, we focused more on preventing the prefetching of timely and accurate data into the caches. To this end, we utilized a random cyclic singly linked list, rather than purely relying on array sizes to isolate a specific level of the cache hierarchy. While it appears that the CPU we use for our benchmarks has a data dependent prefetcher present, it still cannot accurately prefetch a random linked list. Thus our L3 benchmark bypasses both the streaming prefetcher (assumed to be SPP-like since we are using an Intel processor) and the DPP prefetcher. To account for the overhead of timing, we time an empty instruction 50,000 times. This is then subtracted in the final calculations. The setup for each level of the caches are the same, the only variable is the size of our workload.
L1 Latency
When measuring the L1 cache latency, we ensure that the array fits comfortably, which for the i9- 13900K means the array must be less than 37.33 KiB per. To be exact, our array is of size 32768 bytes, or 32 KiB. According to our benchmark, an L1 cache access takes 2.4 cycles.
L2 Latency
The benchmarking protocol for the L2 is exactly the same as the L1, except we increase the size of the array that is being accessed to be too large to fit in the L1, but comfortably fit within the L2. The resulting latency is 18.1 cycles to access the L2 cache. The l2 l.cc file in the src directory contains a pointer chasing benchmark that we wrote as well to cross-check our results. The result is nearly identical.
L3 Latency
As previously mentioned, we use a pointer chasing to determine the latency of the L3 cache. The size of the linked list is bigger than the L2 cache, and smaller than the L3. We find the L3 cache latency is 31.6 cycles
Cache Bandwidth (L1I/L1D/L2/L3)
L1I Bandwidth
This is very similar to 4.3. We aligned NOP8 to a 16 byte boundary. We measured the number of
number of instruction executed and the number of cycles. We found that the L1I bandwidth is 16
Bytes/cycle.
L1D Bandwidth
A uint64_t array of size 48KiB was created as following:
aligned(64))) uint64_t src[(48 * 1024) / sizeof(uint64_t)] = { 0 };
...
asm volatile("mov %%rax, %0" : : "m"(src[0]) :);
asm volatile("mov %%rbx, %0" : : "m"(src[8]) :);
asm volatile("mov %%rcx, %0" : : "m"(src[16]) :);
asm volatile("mov %%rdx, %0" : : "m"(src[24]) :);
asm volatile("mov %%r8, %0" : : "m"(src[32]) :);
asm volatile("mov %%r9, %0" : : "m"(src[40]) :);
asm volatile("mov %%r10, %0" : : "m"(src[48]) :);
asm volatile("mov %%r11, %0" : : "m"(src[56]) :);
asm volatile("mov %%r12, %0" : : "m"(src[64]) :);
asm volatile("mov %%r13, %0" : : "m"(src[72]) :);
asm volatile("mov %%r14, %0" : : "m"(src[80]) :);
asm volatile("mov %%r15, %0" : : "m"(src[88]) :);
This array was accessed first to bring to L1. Then every $8^{th}$ element(64B which is the cache line
size) was being accessed. It was found that L1D was able to load 1 instruction/cycle. This is possible
due to plethora of independent reads that the CPU can use. Each uint64_t is 8B. Hence the read
bandwidth is 8 Bytes/cycle.
Similarly for load through put was measured.
asm volatile("mov %0, %%rbx" : "=m"(src[8])::);
asm volatile("mov %0, %%rcx" : "=m"(src[16])::);
asm volatile("mov %0, %%rdx" : "=m"(src[24])::);
asm volatile("mov %0, %%r8" : "=m"(src[32])::);
asm volatile("mov %0, %%r9" : "=m"(src[40])::);
asm volatile("mov %0, %%r10" : "=m"(src[48])::);
asm volatile("mov %0, %%r11" : "=m"(src[56])::);
asm volatile("mov %0, %%r12" : "=m"(src[64])::);
asm volatile("mov %0, %%r13" : "=m"(src[72])::);
asm volatile("mov %0, %%r14" : "=m"(src[80])::);
asm volatile("mov %0, %%r15" : "=m"(src[88])::);
The store throughput was 0.37 stores/cycle, which equates to 3 B/cycle for writing.
L1D Bandwidth: AVX
To be sure that we are actually saturating the L1D bandwidth we experimented with AVX instructions.
Specifically we moved 256b (32B) chunks of memory during each load using the VMOVDQA instruction.
This was measured using the traditional CPUID;RDTSC;...;RDTSCP;CPUID harness. For reasons
unknown to us PERF_COUNT_HW_INSTRUCTIONS failed to register any of the vector instructions.
asm volatile("VMOVDQA %%ymm0, %0+%1" ::"m"(src), "i"(0) :);
asm volatile("VMOVDQA %%ymm1, %0+%1" ::"m"(src), "i"(32) :);
asm volatile("VMOVDQA %%ymm2, %0+%1" ::"m"(src), "i"(64) :);
asm volatile("VMOVDQA %%ymm3, %0+%1" ::"m"(src), "i"(96) :);
asm volatile("VMOVDQA %%ymm4, %0+%1" ::"m"(src), "i"(128) :);
asm volatile("VMOVDQA %%ymm5, %0+%1" ::"m"(src), "i"(160) :);
asm volatile("VMOVDQA %%ymm6, %0+%1" ::"m"(src), "i"(192) :);
asm volatile("VMOVDQA %%ymm7, %0+%1" ::"m"(src), "i"(224) :);
asm volatile("VMOVDQA %%ymm8, %0+%1" ::"m"(src), "i"(256) :);
asm volatile("VMOVDQA %%ymm9, %0+%1" ::"m"(src), "i"(288) :);
asm volatile("VMOVDQA %%ymm10, %0+%1" ::"m"(src), "i"(320) :);
asm volatile("VMOVDQA %%ymm11, %0+%1" ::"m"(src), "i"(352) :);
asm volatile("VMOVDQA %%ymm12, %0+%1" ::"m"(src), "i"(384) :);
asm volatile("VMOVDQA %%ymm13, %0+%1" ::"m"(src), "i"(416) :);
asm volatile("VMOVDQA %%ymm14, %0+%1" ::"m"(src), "i"(448) :);
asm volatile("VMOVDQA %%ymm15, %0+%1" ::"m"(src), "i"(480) :);
We found that the CPU is capable of 1.70 256b loads/cycles and 1.93 256b stores/cycles. This equates to 54.36 Bytes/cycle read and 61.67 Bytes/cycle write.
L2 Bandwidth
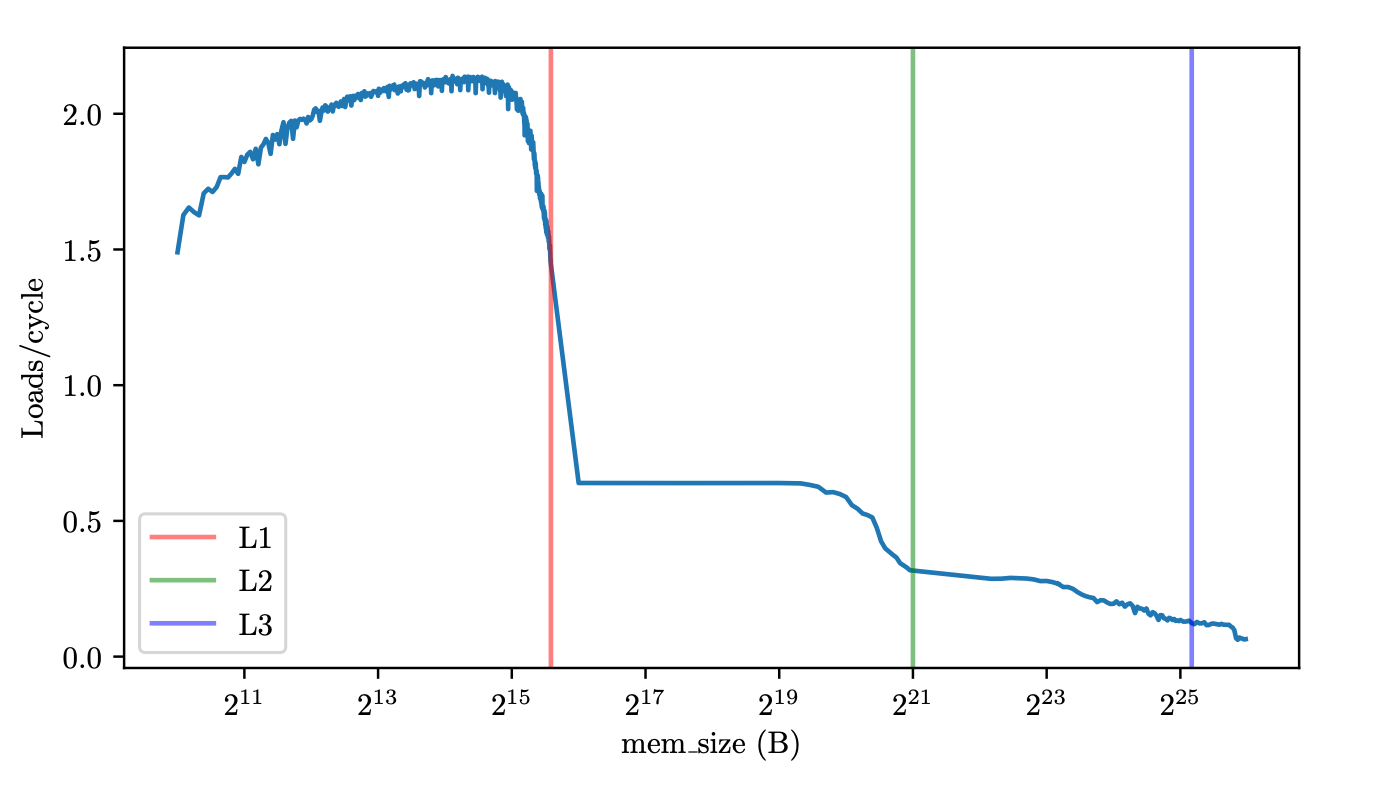
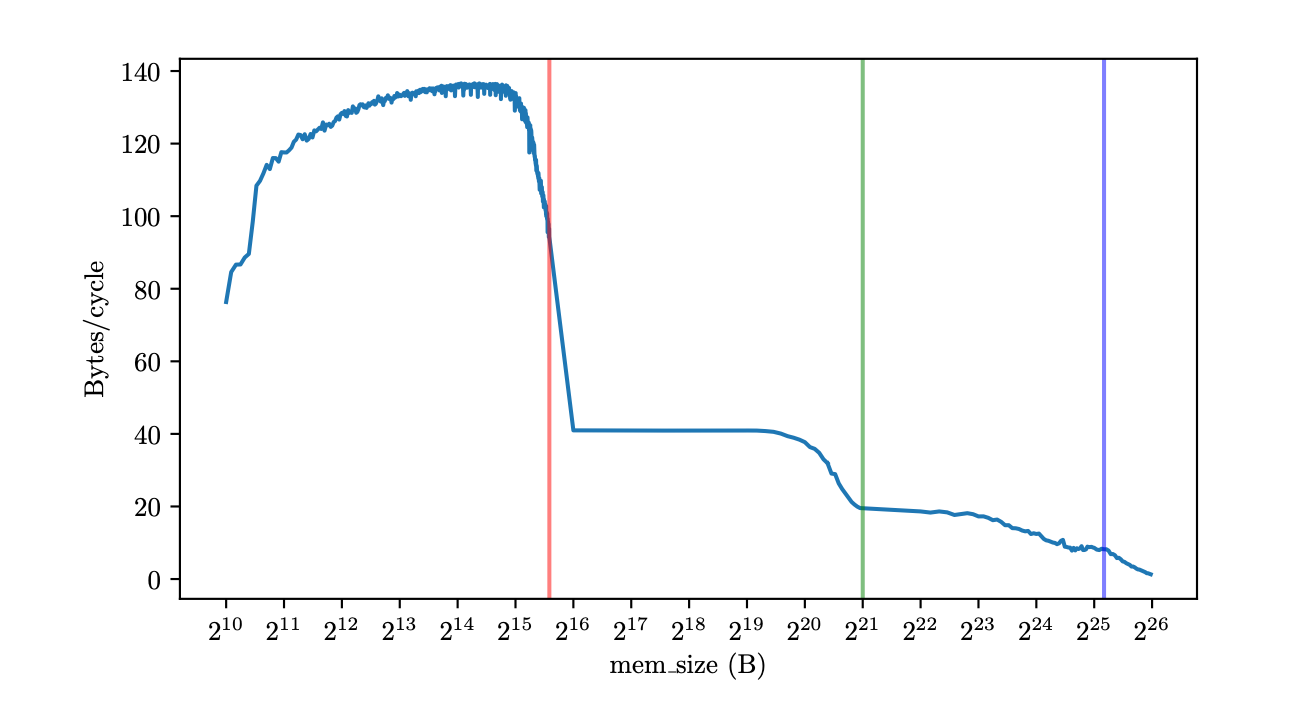
For measuring L2 Bandwidth we use 11 independent pointer chases. We experimented with striding an array larger that L1 but smaller than L2 but failed to get reliable measurement possibly due to the prefetcher. Hence we used pointer chasing where the prefetcher is less likely to interfere. The pointer chasing benchmark is as follows:
- Given a memory block size, create mem size/64 number of nodes. Here node is special struct list node struct. It is defined as follows
struct list_node_struct {
struct list_node_struct *next;
unsigned char padding[PADDING];
};
PADDINGis set of 4096B which is the default paging size in Linux. It is alleged that prefetcher only works within a memory page. By padding each of our pointer with 4096, we think that the prefetcher won’t interfere.- Iterate through the linked list,setting value of each of the nodes to the next. The last item is set back to the . We want to iterate through this loop multiple times, this just helps to keep the code neater.
asm volatile("mov %%rbx, %0" ::"m"(curr1) :);
asm volatile("mov %%rcx, %0" ::"m"(curr1) :);
asm volatile("mov %%rdx, %0" ::"m"(curr1) :);
asm volatile("mov %%r8, %0" ::"m"(curr1) :);
asm volatile("mov %%r9, %0" ::"m"(curr1) :);
asm volatile("mov %%r10, %0" ::"m"(curr1) :);
asm volatile("mov %%r11, %0" ::"m"(curr1) :);
asm volatile("mov %%r12, %0" ::"m"(curr1) :);
asm volatile("mov %%r13, %0" ::"m"(curr1) :);
asm volatile("mov %%r14, %0" ::"m"(curr1) :);
asm volatile("mov %%r15, %0" ::"m"(curr1) :);
asm volatile("mov %%rax, %0" ::"m"(num_accesses) : "rax");
asm volatile("jmp condition");
asm volatile("loop:" :::);
asm volatile("mov %%rbx, [%%rbx]" :::);
asm volatile("mov %%rcx, [%%rcx]" :::);
asm volatile("mov %%rdx, [%%rdx]" :::);
asm volatile("mov %%r8, [%%r8]" :::);
asm volatile("mov %%r9, [%%r9]" :::);
asm volatile("mov %%r10, [%%r10]" :::);
asm volatile("mov %%r11, [%%r11]" :::);
asm volatile("mov %%r12, [%%r12]" :::);
asm volatile("mov %%r13, [%%r13]" :::);
asm volatile("mov %%r14, [%%r14]" :::);
asm volatile("mov %%r15, [%%r15]" :::);
asm volatile("sub %%rax, 0x1" ::: "rax");
asm volatile("condition: cmp %%rax, 0x0" ::"m"(num_accesses)
: "rax");
asm volatile("jne loop" :::);
asm volatile("mov %0, %%rax" : "=m"(num_accesses) : : "memory");
asm volatile("lfence");
For a mem_size of 64KiB, we get a bandwidth of 0.46 loads/cycle.
L3 Bandwidth
Continuing the same technique we set mem size to be greater than 2048K but smaller than 36864K, we got a throughput of 0.1 loads/cycle.
Main Memory (DRAM) Latency
We continue to use the pointer chasing workload that was used for the L3 cache to measure main memory access. We make the array just big enough such that it will not fit in the L3 cache. This is to avoid timing the faulting in of pages into memory that would be required for a massive linked list. The rest of the setup is identical to the L3 cache latency benchmark. We find that the average latency for a DRAM access is 98.7 cycles, or about 33 ns with a 3.00 GHz clock.
Main Memory (DRAM) Bandwidth
To test DRAM bandwidth we ran the parallel pointer chasing choosing a mem size > 36864KiB. We found that the throughput was 0.05 loads/cycle
SMT Contention and Symbiosis
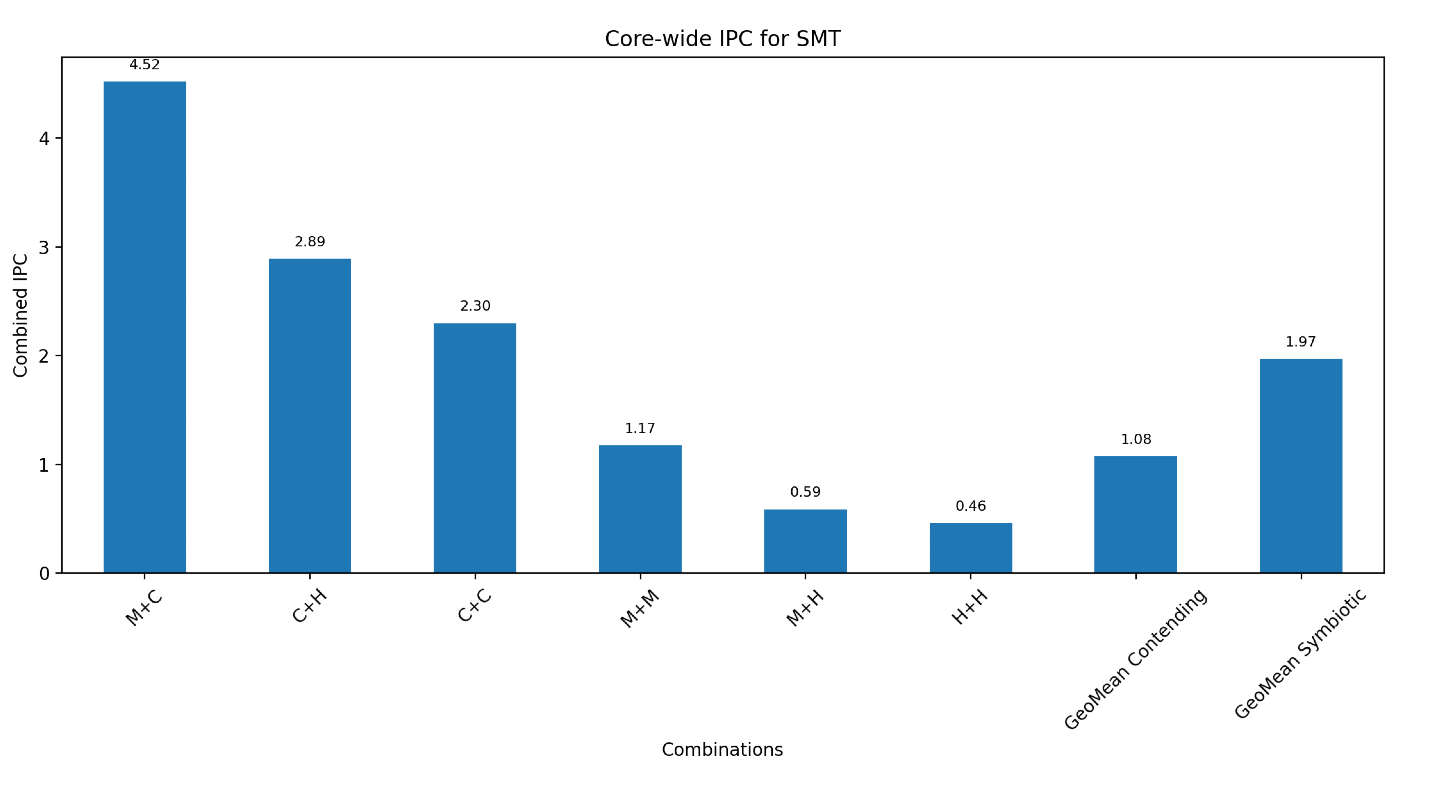
To measure the impact of workloads that contend for resources against those that are symbiotic
in nature, we run three types of workloads. Compute intensive, memory intensive, and a hybrid
of memory and compute intensive. The workloads that compete for resources, i.e. compute and
compute, show a decrease in IPC compared to workloads that are symbiotic, i.e. compute and
memory, as shown in Figure 7. We collected results using perf, and pinned each workload to sibling
threads – four and five in our case. Note: the SMT tests are run by executing the smt_test.sh file.
Summary
| Category | Metric | Measured Value | Notes (How Measured) |
|---|---|---|---|
| CPU Details | CPU Model | 13th Gen IntelR CoreTM i9-13900K | cat /proc/cpuinfo |
| Cores / Threads | 24/32 | ||
| Base / Turbo Frequency | 3.00 GHz /5.80 GHz | ||
| Cache Sizes (L1(I/D)/L2/L3) | (32K/48K, 2048K, 36864K) | ||
| Memory (type/capacity) | DDR5/32G | ||
| Basic | Function Call | 40 cycles | Call empty func between rdtsc |
| Context Switch | 316 cycles | Timing getppid |
|
| Pipeline | Instr.\ Fetch Throughput | 2 full width instructions/cycle | Loading lots of NOPS16 |
| Instr.\ Retire Throughput | min: .61, max: 4.55, med: 1.62 | Measuring retirements for varying workloads | |
| Loads per Cycle | 2.27 loads/cycle | Unrolled independent MOV r64, m64 |
|
| Stores per Cycle | 0.87 stores/cycle | Unrolled independed MOV m64, r64 |
|
| Branch Misprediction Penalty | 22 cycles | ||
| Execution Unit Bandwidth | |||
| – INT ALU | 4.8 ops/cycle | Independent ADD RAX, RAX |
|
| – INT Multiply | 0.33 ops/cycle | MUL R8 |
|
| – INT Divide | 0.10 ops/cycle | DIV RBX |
|
| SMT Effects | Contending Workloads | 1.08 IPC | Collocating symbiotic and contending workloads on t0 and t1 |
| Symbiotic Workloads | 1.97 IPC | ||
| Cache Latency | L1I | Pointer chasing and large array accesses | |
| L1D | 2.4 cycles | ||
| L2 | 18.1 cycles | ||
| L3 | 31.6 cycles | ||
| Cache Bandwidth | L1I Read/Write | 16B/cycle | Measured #(NOPS8) / cycle |
| L1D Read/Write | 8/3 B/cycle | MOV r64, m64 |
|
| L1D AVX256 Read/Write | 54/61 B/cycle | VMOVDQA YMM, m256 |
|
| L2 Read/Write | 0.46 loads/cycle | Parallel Independent pointer chase | |
| L3 Read/Write | 0.11 loads/cycle | Parallel Independent pointer chase | |
| Main Memory | DRAM Latency | 98.7 cycles | |
| DRAM Bandwidth | 0.05 loads/cycle | Parallel independent pointer chase |